
Pathology-anatomic and clinical Residency
Pathology Residency - Experience
Dr. T., AP/CP pathology resident, university-based program in the Midwest
While often underrated, the field of pathology is extremely broad with many different areas that one can specialize in. In general, pathology is divided into anatomic pathology and clinical pathology. In anatomic pathology (AP), pathologists work with specimens that have been removed via surgery, biopsy, etc. They will process the specimen, termed grossing, and decide which portions of the specimen are important to look at under the microscope. Following grossing, AP pathologists will look at histology using a microscope to render different diagnoses, determine in margins are positive, and so much more. AP pathologists are also trained to perform autopsies, although many do not perform autopsies following completion of training. Clinical pathologists (CP) on the other hand, essentially oversee the laboratory. This includes everything from chemistry tests such as complete blood counts (CBCs), to running the blood bank, the microbiology lab, and exploring the informatics of medicine.
When applying to pathology residency there are several different training routes one can consider. Many pathology residents choose to complete a 4 year combined AP/CP residency, which is the most common. However, one can also complete a 3 year AP only or CP only residency. Many also choose to complete a fellowship and further subspecialize. My training program takes around 12 residents a year with the majority being AP/CP and a few being AP only and CP only. We also offer a few Physician Scientist Training Program (PSTP) slots for individuals needing to finish their post-PhD research. We have an integrated AP/CP curriculum with trainees spending time on both portions throughout the year. Additionally, similarly to many other programs in pathology, we have one of the most diverse populations of trainees with pathologists hailing from different countries with varying backgrounds, training, etc.
AP trainees typically work around 8-12 hour days which are split up into looking at cases on your own (called previewing), reviewing cases with your attending (called sign out), and grossing specimens. We also have an educational noon didactic most days. At my program, we have subspecialty sign out, meaning that trainees are only on one service at a time. Subspecialties include cardiothoracic, breast, gynecology, genitourinary, renal, neurology, head and neck, dermatology, bone and soft tissue, pediatrics, gastrointestinal, hematopathology, cytology, and frozen section. All AP trainees must also complete 30 autopsies to graduate residency. While not necessarily viewed as glamorous, autopsies play an impactful role in healthcare. For example, an autopsy case may show widely metastatic cancer that was not known prior to death or a newly approved medical device that embolized within the patient’s circulatory system leading to their death. Autopsies also help to educate clinical providers and provide closure for the decedent’s family.
CP trainees typically work around 8-10 hours. Our CP rotations include microbiology, transfusion medicine, coagulation, chemistry, and molecular. They will take call approximately 1/3 of the time they are on a CP rotation. While on call, CP trainees will oversee the approval of certain lab tests, problem solve lab issues, and spend time in the lab with laboratory technicians. For example, CP trainees may be called regarding an elevated troponin level in an asymptomatic patient which ends up being interference by a macrotroponin complex. My program also has all trainees complete an informatics course and has other optional electives such as a lab management course.
At my program, both AP and CP trainees have varying levels of graduated responsibilities. As they progress further through residency, AP trainees begin to gross specimen, make diagnoses on intra-operative frozen sections, and order special or immunohistochemical (IHC) stains on their cases without direct supervision. CP trainees will begin to answer calls and consults without attending intervention and troubleshoot lab problems on their own. It is vital to have graduated responsibilities throughout training, as it helps to prepare upper level trainees to transition to practicing on their own.
One of my favorite parts about pathology is how collegial my program (and the field in general is). My co-residents and fellows get along well, are always kind, and happy to help if/when needed. We share interesting cases and teach each other a lot. Generally, pathology residency allows for a good work-life balance, which usually continues upon graduation. Additionally, the pathology job market is very hot right now, with many graduating seniors receiving multiple job offers. Overall, I would definitely recommend the field of pathology to anyone who is trying to decide on their future career path in medicine. It is an inquisitive field with diverse individuals, and a wide variety of different types of jobs which allows physicians the flexibility of practicing in an area in which they are most interested in.
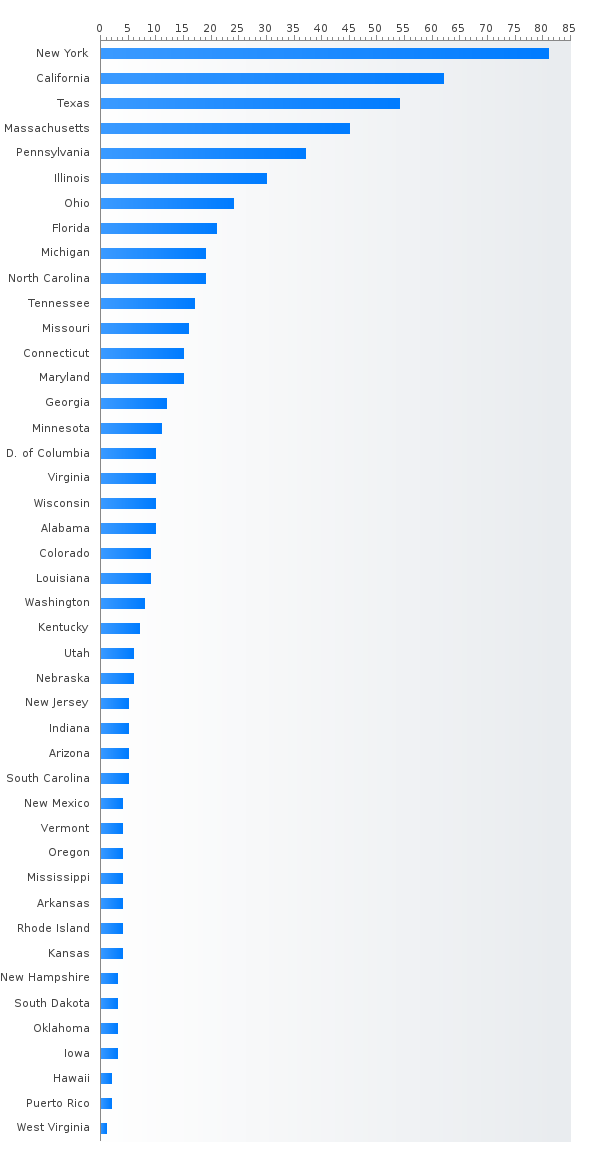
Read morePGY-1 Pathology-anatomic and clinical residency positions by state
- New York (81)
- California (60)
- Texas (47)
- Massachusetts (46)
- Pennsylvania (36)
- Illinois (31)
- Ohio (27)
- Florida (27)
- Michigan (20)
- Maryland (18)
- North Carolina (17)
- Missouri (15)
- Connecticut (13)
- Wisconsin (12)
- Tennessee (12)
- Georgia (11)
- Minnesota (11)
- Louisiana (11)
- Virginia (10)
- District of Columbia (9)
- Alabama (9)
- Colorado (9)
- Washington (8)
- Kentucky (8)
- Utah (7)
- Iowa (7)
- New Jersey (7)
- Nebraska (6)
- South Carolina (6)
- Indiana (5)
- Arkansas (5)
- Vermont (4)
- Oklahoma (4)
- Oregon (4)
- Mississippi (4)
- Arizona (4)
- Rhode Island (4)
- New Hampshire (4)
- Kansas (4)
- New Mexico (4)
- Hawaii (3)
- Puerto Rico (3)
- South Dakota (2)
- West Virginia (1)
Most competitive Pathology-anatomic and clinical residencies - Top 20 ranking
Top 10 most competitive Pathology residencies with %DO > 25
Percent MD,DO,IMG Pathology-anatomic and clinical PGY-1 residents (main match)
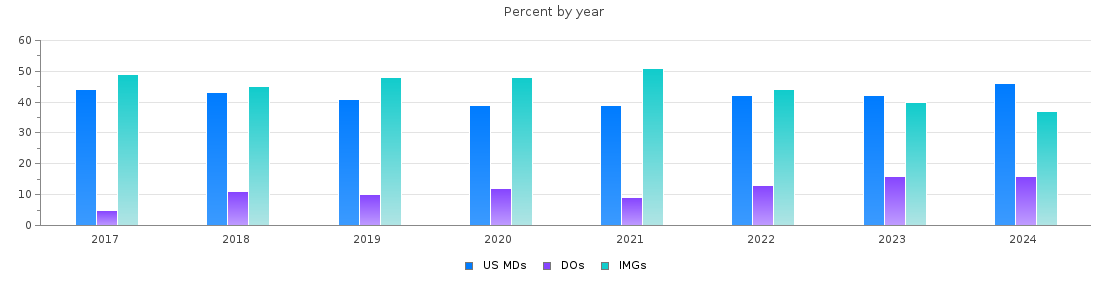
Pathology-anatomic and clinical PGY-1 main residency Match statistics
| Year | Positions | Filled(%) | MD | DO | IMGs |
| 2026 | 636 | 99.7 | 290 (45 %) | 124 (19 %) | 220 (34 %) |
| 2025 | 622 | 99.5 | 283 (45 %) | 111 (17 %) | 225 (36 %) |
| 2024 | 628 | 98.9 | 287 (45 %) | 102 (16 %) | 232 (36 %) |
| 2023 | 613 | 99.0 | 261 (42 %) | 98 (15 %) | 248 (40 %) |
| 2022 | 631 | 98.1 | 260 (41 %) | 85 (13 %) | 274 (43 %) |
| 2021 | 611 | 96.4 | 230 (37 %) | 58 (9 %) | 301 (49 %) |
| 2020 | 603 | 97.3 | 230 (38 %) | 71 (11 %) | 286 (47 %) |
| 2019 | 591 | 94.6 | 230 (38 %) | 57 (9 %) | 270 (45 %) |
| 2018 | 601 | 94.5 | 245 (40 %) | 66 (10 %) | 257 (42 %) |
| 2017 | 601 | 90.7 | 241 (40 %) | 32 (5 %) | 272 (45 %) |