
Orthopaedic surgery Residency
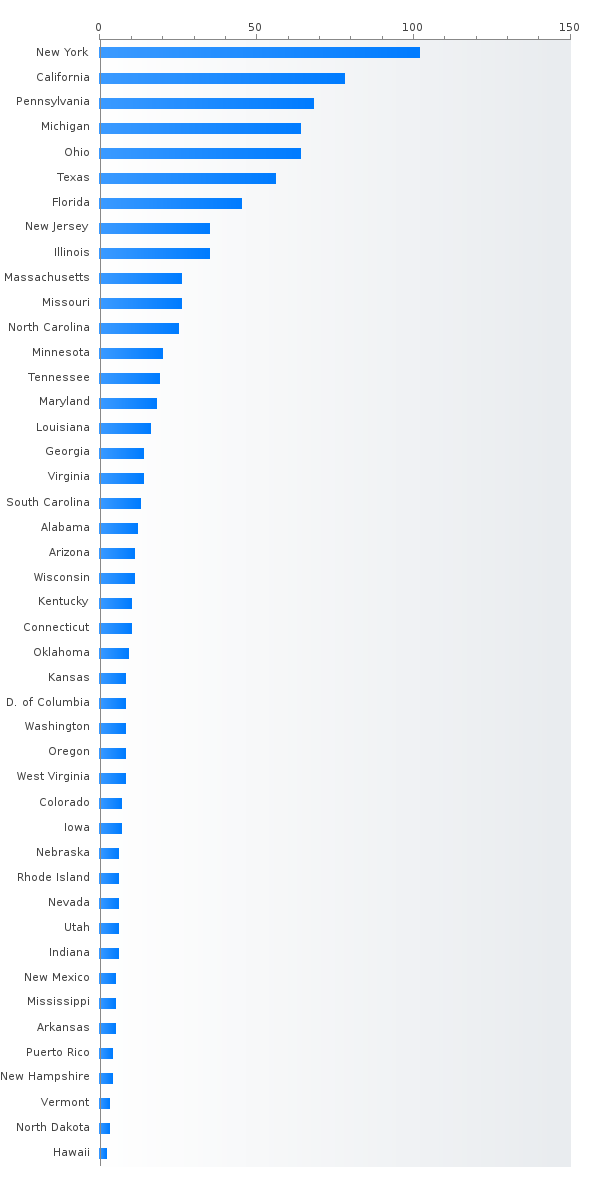
PGY-1 Orthopaedic surgery residency positions by state
- New York (111)
- California (80)
- Pennsylvania (69)
- Ohio (67)
- Michigan (64)
- Texas (63)
- Florida (48)
- New Jersey (37)
- Illinois (35)
- Missouri (27)
- Massachusetts (26)
- North Carolina (25)
- Minnesota (21)
- Tennessee (20)
- Maryland (19)
- Louisiana (16)
- Georgia (15)
- Virginia (15)
- South Carolina (13)
- Alabama (12)
- Arizona (12)
- Wisconsin (12)
- District of Columbia (11)
- Connecticut (10)
- Oklahoma (10)
- Kentucky (10)
- West Virginia (9)
- Washington (8)
- Oregon (8)
- Puerto Rico (8)
- Kansas (8)
- Colorado (8)
- Iowa (7)
- Utah (6)
- Indiana (6)
- Nebraska (6)
- Nevada (6)
- Rhode Island (6)
- New Mexico (5)
- Mississippi (5)
- Arkansas (5)
- New Hampshire (5)
- Vermont (4)
- North Dakota (3)
- Hawaii (2)
Most competitive Orthopaedic surgery residencies - Top 20 ranking
ID / Ranking Program State
Top 10 most competitive Orthopaedic Surgery residencies with %DO > 25
ID / Ranking Program State
Search by criteria to find more information about best Orthopaedic Surgery residency programs.
Percent MD,DO,IMG Orthopaedic surgery PGY-1 residents (main match)
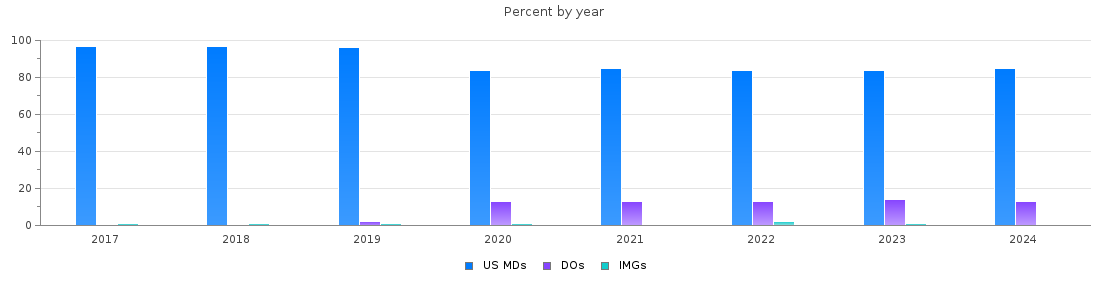
Orthopaedic surgery PGY-1 main residency Match statistics
| Year | Positions | Filled(%) | MD | DO | IMGs |
| 2026 | 963 | 100.0 | 818 (84 %) | 135 (14 %) | 10 (1 %) |
| 2025 | 929 | 100.0 | 767 (82 %) | 140 (15 %) | 22 (2 %) |
| 2024 | 916 | 99.9 | 779 (85 %) | 128 (13 %) | 8 (0.9 %) |
| 2023 | 899 | 100.0 | 759 (84 %) | 126 (14 %) | 12 (1 %) |
| 2022 | 875 | 100.0 | 741 (84 %) | 115 (13 %) | 19 (2 %) |
| 2021 | 868 | 99.8 | 739 (85 %) | 119 (13 %) | 8 (0.9 %) |
| 2020 | 849 | 99.4 | 714 (84 %) | 118 (13 %) | 12 (1 %) |
| 2019 | 743 | 99.6 | 715 (96 %) | 15 (2 %) | 10 (1 %) |
| 2018 | 742 | 99.5 | 720 (97 %) | 5 (0.7 %) | 13 (1 %) |
| 2017 | 727 | 99.9 | 710 (97 %) | 3 (0.4 %) | 13 (1 %) |