
Medical Residency in Ohio
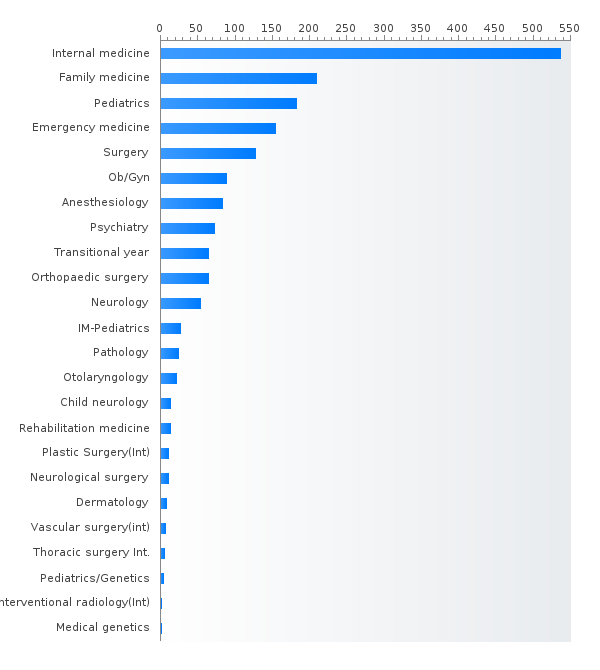
PGY-1 residency positions in Ohio
- Internal medicine (549)
- Family medicine (216)
- Pediatrics (176)
- Emergency medicine (159)
- Surgery (135)
- Anesthesiology (90)
- Obstetrics and gynecology (90)
- Psychiatry (84)
- Orthopaedic surgery (67)
- Neurology (56)
- Transitional year (55)
- Internal Medicine-Pediatrics (28)
- Pathology-anatomic and clinical (27)
- Otolaryngology - Head and Neck surgery (22)
- Physical medicine and rehabilitation (15)
- Child neurology (15)
- Neurological surgery (14)
- Plastic surgery - Integrated (12)
- Dermatology (8)
- Thoracic surgery - integrated (5)
- Pediatrics/Medical Genetics (4)
- Medical genetics and genomics (1)
- Interventional radiology - integrated (1)
Top size residency programs in Ohio by specialty
Specialty ID Program
Search residency programs by criteria to find all the programs you really need!
Percent MD,DO,IMG residents matched PGY-1 in Ohio (main match)
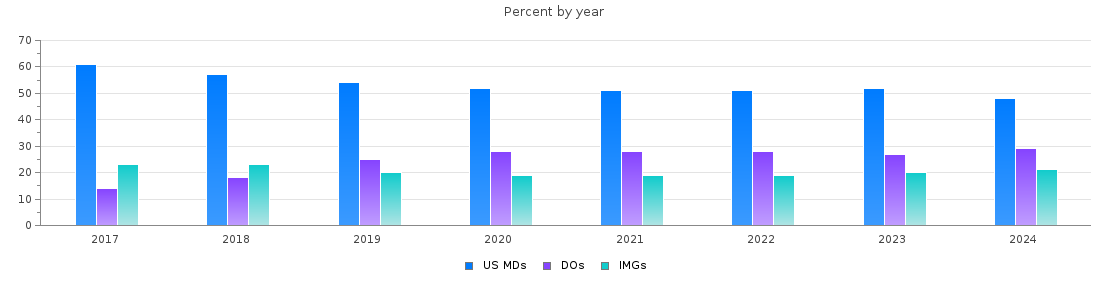
Ohio PGY-1 main residency Match statistics
| Year | Positions | Filled(%) | MD | DO | IMGs |
| 2026 | 1829 | 92.2 | 856 (46%) | 463 (25%) | 368 (20%) |
| 2025 | 1714 | 95.6 | 775 (45%) | 454 (26%) | 409 (23%) |
| 2024 | 1785 | 93.3 | 813 (45%) | 487 (27%) | 366 (20%) |
| 2023 | 1785 | 91.0 | 849 (47%) | 439 (24%) | 336 (18%) |
| 2022 | 1758 | 94.8 | 854 (48%) | 479 (27%) | 333 (18%) |
| 2021 | 1715 | 95.7 | 849 (49%) | 465 (27%) | 327 (19%) |
| 2020 | 1704 | 95.7 | 848 (49%) | 465 (27%) | 317 (18%) |
| 2019 | 1541 | 94.7 | 798 (51%) | 365 (23%) | 297 (19%) |
| 2018 | 1440 | 95.5 | 789 (54%) | 256 (17%) | 329 (22%) |
| 2017 | 1372 | 97.1 | 825 (60%) | 195 (14%) | 312 (22%) |
Read about Top IMG friendly residency programs in Ohio
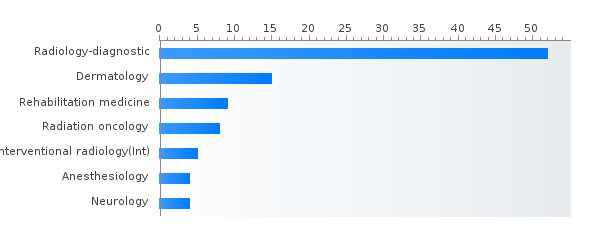
PGY-2 residency positions in Ohio
- Radiology-diagnostic (54)
- Dermatology (16)
- Physical medicine and rehabilitation (9)
- Radiation oncology (8)
- Interventional radiology - integrated (6)
- Neurology (5)
- Anesthesiology (4)
Percent MD,DO,IMG residents matched PGY-2 in Ohio (main match)
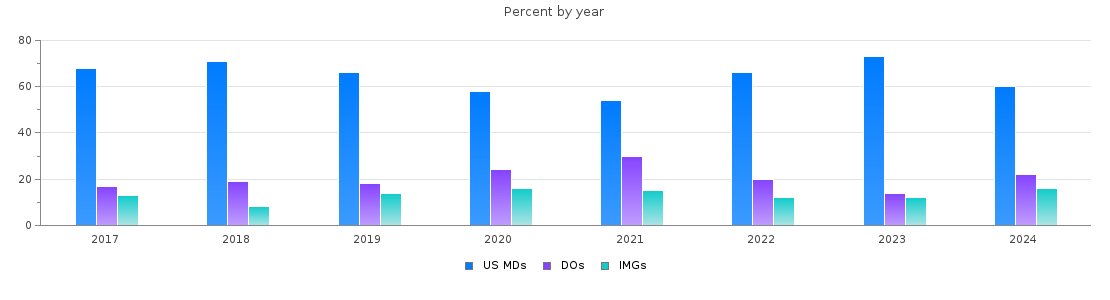
Ohio PGY-2 main residency Match statistics
| Year | Positions | Filled(%) | MD | DO | IMGs |
| 2026 | 102 | 100.0 | 65 (63%) | 18 (17%) | 19 (18%) |
| 2025 | 104 | 100.0 | 59 (56%) | 28 (26%) | 17 (16%) |
| 2024 | 97 | 100.0 | 59 (60%) | 22 (22%) | 16 (16%) |
| 2023 | 101 | 97.0 | 72 (71%) | 14 (13%) | 12 (11%) |
| 2022 | 96 | 100.0 | 64 (66%) | 20 (20%) | 12 (12%) |
| 2021 | 93 | 98.9 | 50 (53%) | 28 (30%) | 14 (15%) |
| 2020 | 98 | 99.0 | 57 (58%) | 24 (24%) | 16 (16%) |
| 2019 | 98 | 98.0 | 64 (65%) | 18 (18%) | 14 (14%) |
| 2018 | 92 | 98.9 | 65 (70%) | 18 (19%) | 8 (8%) |
| 2017 | 93 | 96.8 | 62 (66%) | 16 (17%) | 12 (12%) |