Transitional year Residency Programs in Ohio
Percent MD,DO,IMG PGY-1 residents matched during the main Match
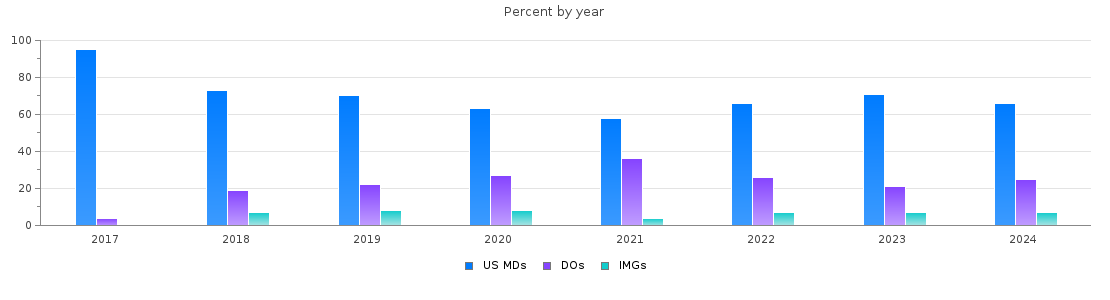
Transitional year PGY-1 main residency Match statistics in Ohio
| Year | Positions | Filled(%) | MD | DO | IMGs |
| 2026 | 55 | 98.2 | 33 (60%) | 16 (29%) | 5 (9%) |
| 2025 | 55 | 96.4 | 29 (52%) | 18 (32%) | 6 (10%) |
| 2024 | 65 | 96.9 | 42 (64%) | 16 (24%) | 5 (7%) |
| 2023 | 69 | 100.0 | 49 (71%) | 15 (21%) | 5 (7%) |
| 2022 | 69 | 100.0 | 46 (66%) | 18 (26%) | 5 (7%) |
| 2021 | 69 | 94.2 | 38 (55%) | 24 (34%) | 3 (4%) |
| 2020 | 69 | 98.6 | 43 (62%) | 19 (27%) | 6 (8%) |
| 2019 | 53 | 94.3 | 35 (66%) | 11 (20%) | 4 (7%) |
| 2018 | 59 | 96.6 | 42 (71%) | 11 (18%) | 4 (6%) |
| 2017 | 49 | 100.0 | 47 (95%) | 2 (4%) | 0 (0%) |