
Medical Residency in Connecticut
Connecticut specific initial medical license requirements
- 2 years of postgraduate residency training.
- No limits on number of attempts for USMLE/COMLEX.
- 7 years to complete USMLE. No time limit on COMLEX
- Accepts Federation Credentials Verification Service.
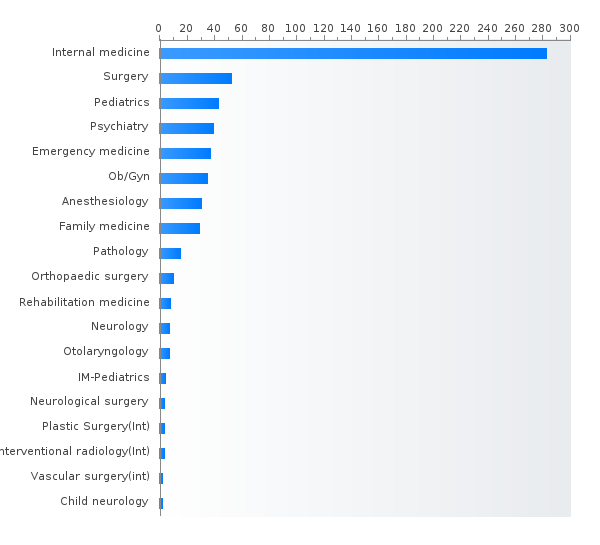
PGY-1 residency positions in Connecticut
- Internal medicine (282)
- Surgery (48)
- Psychiatry (44)
- Pediatrics (43)
- Emergency medicine (37)
- Obstetrics and gynecology (35)
- Anesthesiology (34)
- Family medicine (33)
- Pathology-anatomic and clinical (13)
- Orthopaedic surgery (10)
- Physical medicine and rehabilitation (8)
- Otolaryngology - Head and Neck surgery (7)
- Neurology (7)
- Interventional radiology - integrated (5)
- Internal Medicine-Pediatrics (4)
- Plastic surgery - Integrated (3)
- Neurological surgery (3)
- Child neurology (2)
- Thoracic surgery - integrated (2)
Top size residency programs in Connecticut by specialty
Specialty ID Program
Search residency programs by criteria to find all the programs you really need!
Percent MD,DO,IMG residents matched PGY-1 in Connecticut (main match)
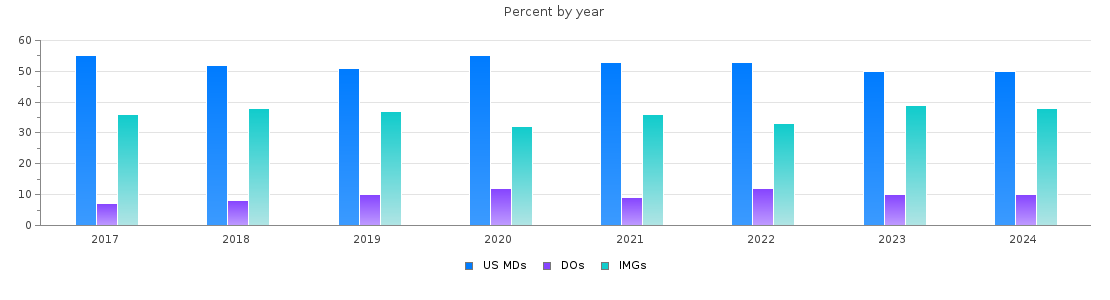
Connecticut PGY-1 main residency Match statistics
| Year | Positions | Filled(%) | MD | DO | IMGs |
| 2026 | 620 | 96.5 | 296 (47%) | 65 (10%) | 237 (38%) |
| 2025 | 568 | 97.7 | 287 (50%) | 88 (15%) | 180 (31%) |
| 2024 | 612 | 97.4 | 303 (49%) | 65 (10%) | 228 (37%) |
| 2023 | 591 | 98.0 | 290 (49%) | 62 (10%) | 227 (38%) |
| 2022 | 582 | 98.5 | 304 (52%) | 74 (12%) | 193 (33%) |
| 2021 | 578 | 98.3 | 305 (52%) | 53 (9%) | 208 (35%) |
| 2020 | 567 | 97.2 | 304 (53%) | 67 (11%) | 179 (31%) |
| 2019 | 552 | 98.4 | 281 (50%) | 58 (10%) | 203 (36%) |
| 2018 | 538 | 95.0 | 270 (50%) | 44 (8%) | 197 (36%) |
| 2017 | 532 | 98.9 | 292 (54%) | 42 (7%) | 192 (36%) |
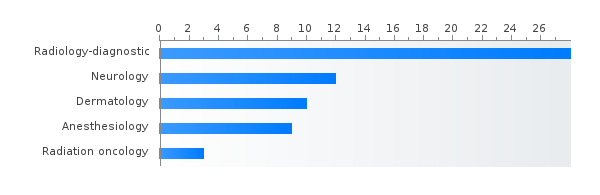
PGY-2 residency positions in Connecticut
- Radiology-diagnostic (32)
- Neurology (13)
- Dermatology (10)
- Anesthesiology (6)
- Radiation oncology (4)
Percent MD,DO,IMG residents matched PGY-2 in Connecticut (main match)
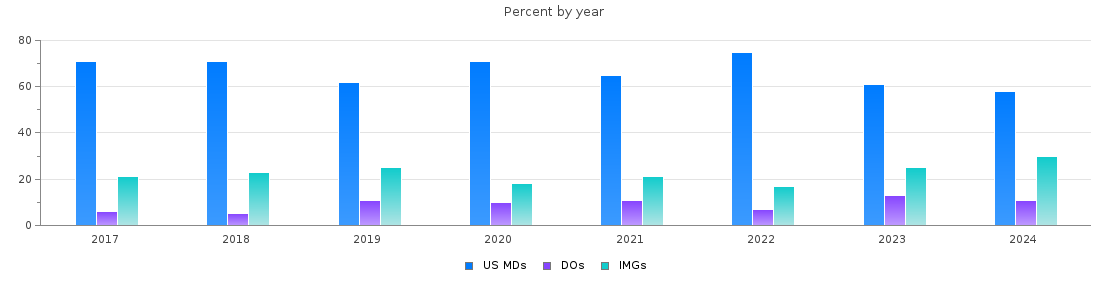
Connecticut PGY-2 main residency Match statistics
| Year | Positions | Filled(%) | MD | DO | IMGs |
| 2026 | 65 | 100.0 | 36 (55%) | 5 (7%) | 24 (36%) |
| 2025 | 65 | 100.0 | 45 (69%) | 6 (9%) | 14 (21%) |
| 2024 | 62 | 100.0 | 36 (58%) | 7 (11%) | 19 (30%) |
| 2023 | 59 | 100.0 | 36 (61%) | 8 (13%) | 15 (25%) |
| 2022 | 57 | 100.0 | 43 (75%) | 4 (7%) | 10 (17%) |
| 2021 | 61 | 100.0 | 40 (65%) | 7 (11%) | 13 (21%) |
| 2020 | 60 | 100.0 | 43 (71%) | 6 (10%) | 11 (18%) |
| 2019 | 59 | 100.0 | 37 (62%) | 7 (11%) | 15 (25%) |
| 2018 | 57 | 98.2 | 40 (70%) | 3 (5%) | 13 (22%) |
| 2017 | 61 | 98.4 | 43 (70%) | 4 (6%) | 13 (21%) |