
Medical Residency in Virginia
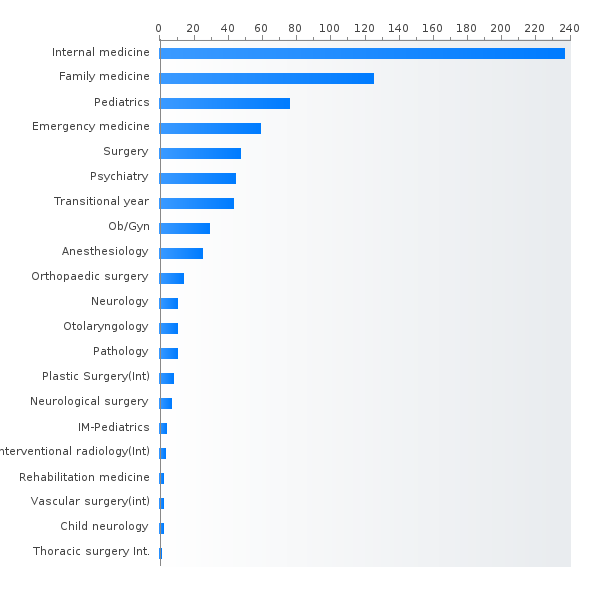
PGY-1 residency positions in Virginia
- Internal medicine (268)
- Family medicine (123)
- Pediatrics (76)
- Emergency medicine (61)
- Surgery (52)
- Psychiatry (49)
- Transitional year (40)
- Obstetrics and gynecology (31)
- Anesthesiology (31)
- Neurology (15)
- Orthopaedic surgery (15)
- Otolaryngology - Head and Neck surgery (10)
- Pathology-anatomic and clinical (10)
- Plastic surgery - Integrated (9)
- Neurological surgery (8)
- Internal Medicine-Pediatrics (4)
- Child neurology (3)
- Interventional radiology - integrated (3)
- Physical medicine and rehabilitation (2)
- Thoracic surgery - integrated (1)
Top size residency programs in Virginia by specialty
Specialty ID Program
Thoracic surgery 4605111096 University of Virginia Medical Center Thoracic surgery residency program
Search residency programs by criteria to find all the programs you really need!
Percent MD,DO,IMG residents matched PGY-1 in Virginia (main match)
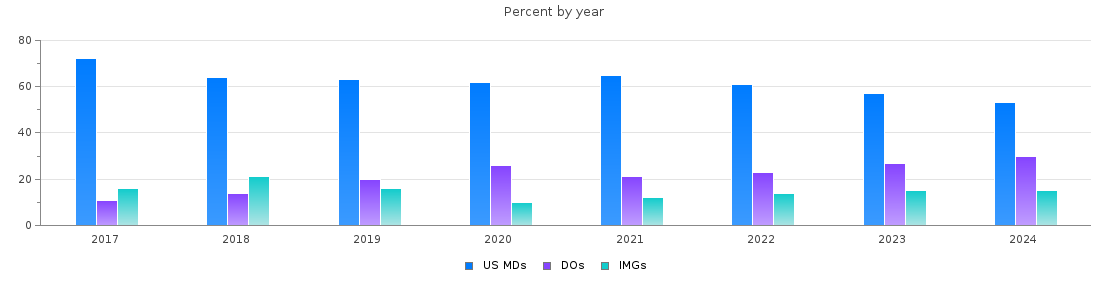
Virginia PGY-1 main residency Match statistics
| Year | Positions | Filled(%) | MD | DO | IMGs |
| 2026 | 811 | 88.8 | 399 (49%) | 186 (22%) | 135 (16%) |
| 2025 | 773 | 89.1 | 382 (49%) | 185 (23%) | 122 (15%) |
| 2024 | 758 | 87.5 | 352 (46%) | 205 (27%) | 106 (13%) |
| 2023 | 709 | 88.9 | 363 (51%) | 171 (24%) | 96 (13%) |
| 2022 | 684 | 89.5 | 378 (55%) | 144 (21%) | 90 (13%) |
| 2021 | 667 | 88.2 | 386 (57%) | 126 (18%) | 76 (11%) |
| 2020 | 638 | 92.5 | 369 (57%) | 157 (24%) | 64 (10%) |
| 2019 | 592 | 93.2 | 351 (59%) | 111 (18%) | 90 (15%) |
| 2018 | 542 | 96.3 | 335 (61%) | 77 (14%) | 110 (20%) |
| 2017 | 517 | 95.7 | 358 (69%) | 55 (10%) | 82 (15%) |
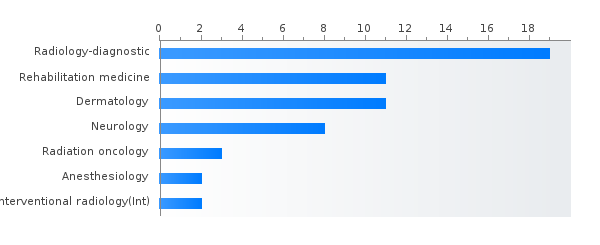
PGY-2 residency positions in Virginia
- Radiology-diagnostic (22)
- Dermatology (12)
- Physical medicine and rehabilitation (11)
- Neurology (8)
- Anesthesiology (2)
- Interventional radiology - integrated (2)
- Radiation oncology (1)
Percent MD,DO,IMG residents matched PGY-2 in Virginia (main match)
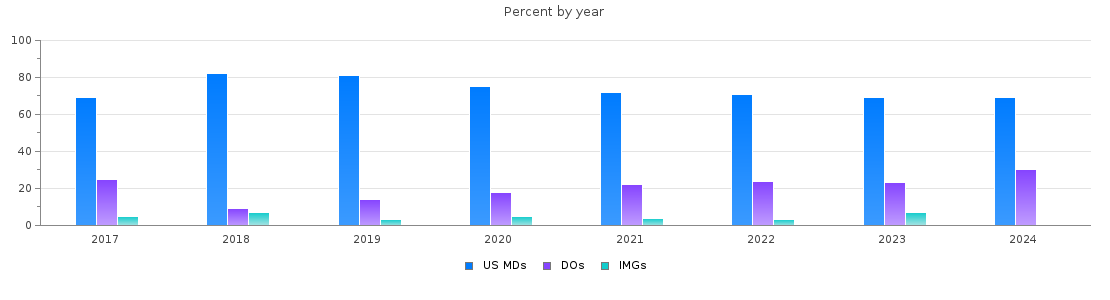
Virginia PGY-2 main residency Match statistics
| Year | Positions | Filled(%) | MD | DO | IMGs |
| 2026 | 58 | 96.6 | 35 (60%) | 17 (29%) | 4 (6%) |
| 2025 | 56 | 94.6 | 36 (64%) | 13 (23%) | 4 (7%) |
| 2024 | 56 | 100.0 | 39 (69%) | 17 (30%) | 0 (0%) |
| 2023 | 56 | 100.0 | 39 (69%) | 13 (23%) | 4 (7%) |
| 2022 | 57 | 100.0 | 41 (71%) | 14 (24%) | 2 (3%) |
| 2021 | 53 | 90.6 | 35 (66%) | 11 (20%) | 2 (3%) |
| 2020 | 58 | 91.4 | 40 (68%) | 10 (17%) | 3 (5%) |
| 2019 | 54 | 100.0 | 44 (81%) | 8 (14%) | 2 (3%) |
| 2018 | 51 | 100.0 | 42 (82%) | 5 (9%) | 4 (7%) |
| 2017 | 52 | 100.0 | 36 (69%) | 13 (25%) | 3 (5%) |