
Dermatology Residency
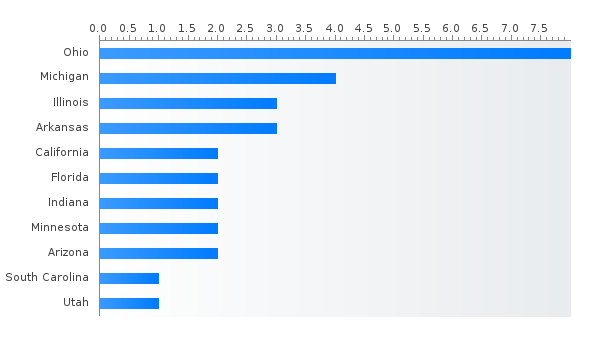
PGY-1 Dermatology residency positions by state
Top size Dermatology residency programs by state
ID / Ranking Program State
Search residency programs by criteria to find all the programs you really need!
Percent MD,DO,IMG Dermatology PGY-1 residents (main match)
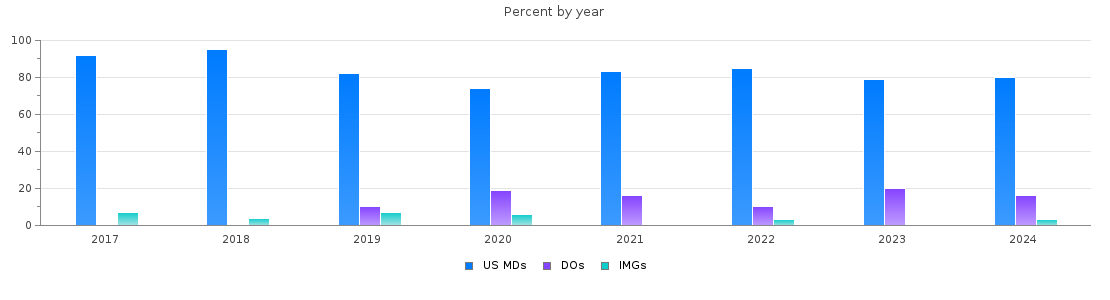
Dermatology PGY-1 main residency Match statistics
| Year | Positions | Filled(%) | MD | DO | IMGs |
| 2026 | 31 | 100.0 | 23 (74 %) | 6 (19 %) | 2 (6 %) |
| 2025 | 30 | 100.0 | 24 (80 %) | 5 (16 %) | 1 (3 %) |
| 2024 | 30 | 100.0 | 24 (80 %) | 5 (16 %) | 1 (3 %) |
| 2023 | 29 | 100.0 | 23 (79 %) | 6 (20 %) | 0 (0 %) |
| 2022 | 30 | 93.3 | 24 (80 %) | 3 (10 %) | 1 (3 %) |
| 2021 | 30 | 100.0 | 25 (83 %) | 5 (16 %) | 0 (0 %) |
| 2020 | 31 | 100.0 | 23 (74 %) | 6 (19 %) | 2 (6 %) |
| 2019 | 30 | 93.3 | 23 (76 %) | 3 (10 %) | 2 (6 %) |
| 2018 | 25 | 92.0 | 22 (88 %) | 0 (0 %) | 1 (4 %) |
| 2017 | 26 | 100.0 | 24 (92 %) | 0 (0 %) | 2 (7 %) |
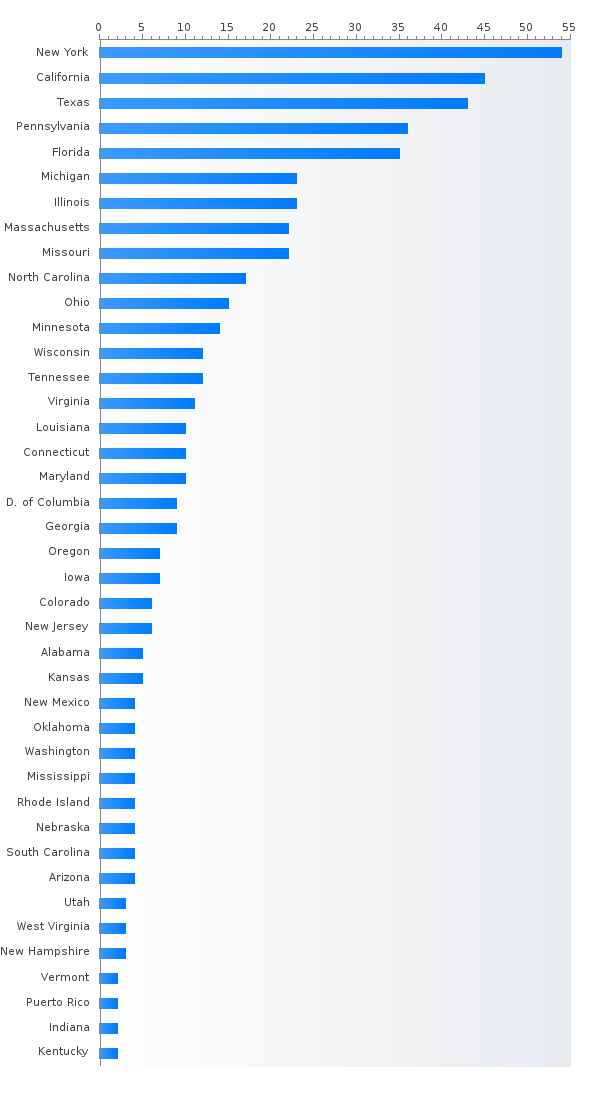
PGY-2 Dermatology residency positions by state
- New York (59)
- California (46)
- Texas (45)
- Florida (37)
- Pennsylvania (34)
- Illinois (25)
- Michigan (24)
- Massachusetts (22)
- Missouri (22)
- North Carolina (17)
- Ohio (16)
- Minnesota (13)
- Virginia (12)
- Tennessee (12)
- Connecticut (10)
- Georgia (10)
- Wisconsin (10)
- Maryland (10)
- Louisiana (9)
- District of Columbia (8)
- Oregon (8)
- Arizona (8)
- Iowa (7)
- South Carolina (7)
- Puerto Rico (6)
- Alabama (6)
- New Jersey (6)
- Colorado (6)
- Washington (5)
- Kansas (5)
- Mississippi (4)
- Indiana (4)
- Nebraska (4)
- Rhode Island (4)
- New Hampshire (4)
- New Mexico (4)
- Utah (4)
- Oklahoma (3)
- West Virginia (3)
- Arkansas (3)
- Vermont (2)
- Kentucky (2)
Percent MD,DO,IMG Dermatology PGY-2 residents (main match)
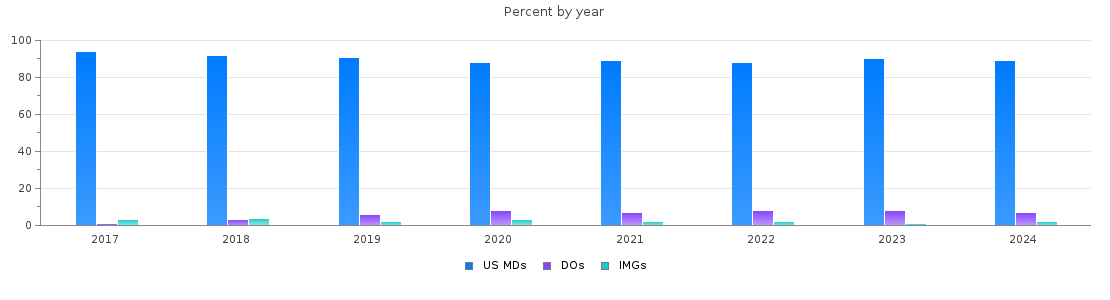
Dermatology PGY-2 main residency Match statistics
| Year | Positions | Filled(%) | MD | DO | IMGs |
| 2026 | 546 | 99.8 | 492 (90 %) | 40 (7 %) | 13 (2 %) |
| 2025 | 524 | 99.8 | 470 (89 %) | 41 (7 %) | 12 (2 %) |
| 2024 | 517 | 99.0 | 457 (88 %) | 40 (7 %) | 15 (2 %) |
| 2023 | 499 | 99.4 | 449 (89 %) | 40 (8 %) | 7 (1 %) |
| 2022 | 492 | 99.4 | 435 (88 %) | 43 (8 %) | 11 (2 %) |
| 2021 | 477 | 98.7 | 422 (88 %) | 37 (7 %) | 12 (2 %) |
| 2020 | 478 | 98.1 | 415 (86 %) | 38 (7 %) | 15 (3 %) |
| 2019 | 440 | 99.3 | 398 (90 %) | 30 (6 %) | 9 (2 %) |
| 2018 | 426 | 98.6 | 387 (90 %) | 13 (3 %) | 18 (4 %) |
| 2017 | 423 | 98.1 | 394 (93 %) | 7 (1 %) | 14 (3 %) |