
Anesthesiology Residency
Anesthesiology residency in numbers
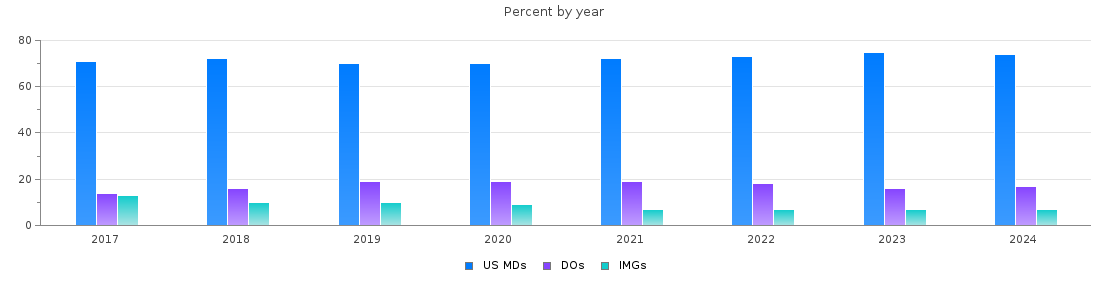
The number of anesthesiology positions increased by 55% over the past 10 years. Today 188 anesthesiology programs offer about 1860 PGY-1 positions and 52 programs offer more than 300 PGY-2 positions. It's about 4% of all residency positions. Most of the matched applicants are US MDs - 73%. Also, 18% DOs and just 7% IMGs. The proportion is stable over the past years. Very close to 100% are filled during the main match and near nothing left for the SOAP. Anesthesiology is enough competitive specialty with a high percent of matched US MDs, relatively high mean scores of matched candidates, and 89%,78%,50% match rates among interviewed US MDs, DOs, and IMGs respectively.
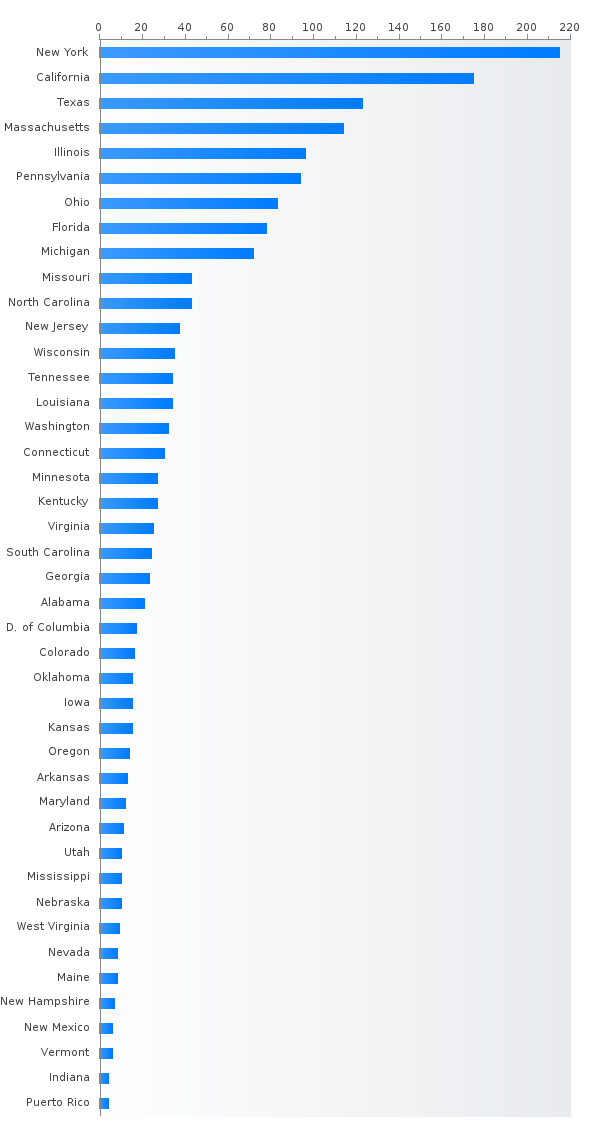
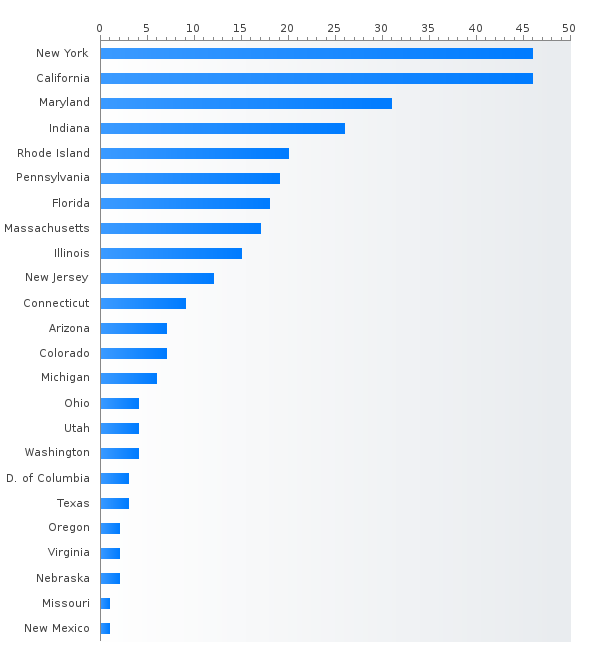
PGY-1 Anesthesiology residency positions by state
- New York (229)
- California (206)
- Texas (125)
- Massachusetts (120)
- Pennsylvania (108)
- Illinois (92)
- Ohio (90)
- Florida (83)
- Michigan (79)
- New Jersey (50)
- North Carolina (45)
- Missouri (44)
- Louisiana (40)
- Tennessee (38)
- Wisconsin (35)
- Connecticut (34)
- Washington (32)
- Virginia (31)
- Maryland (30)
- Kentucky (30)
- Minnesota (27)
- Georgia (24)
- South Carolina (24)
- Alabama (21)
- Arizona (20)
- Oklahoma (19)
- Kansas (19)
- Colorado (16)
- Nebraska (16)
- District of Columbia (15)
- Iowa (15)
- Oregon (14)
- West Virginia (13)
- Arkansas (13)
- New Mexico (10)
- Utah (10)
- Mississippi (10)
- Maine (8)
- Nevada (8)
- New Hampshire (8)
- Vermont (6)
- Indiana (4)
- Puerto Rico (4)
Most competitive Anesthesiology residencies - Top 20 ranking
ID / Ranking Program State
Top 10 most competitive Anesthesiology residencies with %DO > 25
ID / Ranking Program State
Search by criteria to find more information about best Anesthesiology residency programs.
Percent MD,DO,IMG Anesthesiology PGY-1 residents (main match)
Anesthesiology PGY-1 main residency Match statistics
| Year | Positions | Filled(%) | MD | DO | IMGs |
| 2026 | 1865 | 100.0 | 1374 (73 %) | 352 (18 %) | 138 (7 %) |
| 2025 | 1805 | 99.9 | 1350 (74 %) | 321 (17 %) | 131 (7 %) |
| 2024 | 1695 | 100.0 | 1256 (74 %) | 303 (17 %) | 135 (7 %) |
| 2023 | 1609 | 99.8 | 1219 (75 %) | 260 (16 %) | 127 (7 %) |
| 2022 | 1509 | 99.9 | 1107 (73 %) | 283 (18 %) | 118 (7 %) |
| 2021 | 1460 | 99.8 | 1062 (72 %) | 278 (19 %) | 116 (7 %) |
| 2020 | 1370 | 99.9 | 961 (70 %) | 271 (19 %) | 136 (9 %) |
| 2019 | 1322 | 98.4 | 914 (69 %) | 248 (18 %) | 139 (10 %) |
| 2018 | 1253 | 97.8 | 894 (71 %) | 206 (16 %) | 126 (10 %) |
| 2017 | 1202 | 95.3 | 823 (68 %) | 164 (13 %) | 159 (13 %) |
PGY-2 Anesthesiology residency positions by state
- New York (51)
- California (46)
- Florida (31)
- Indiana (30)
- Rhode Island (24)
- Maryland (17)
- Illinois (15)
- Massachusetts (14)
- Pennsylvania (13)
- New Jersey (12)
- Arizona (7)
- Colorado (7)
- Michigan (6)
- Connecticut (6)
- District of Columbia (5)
- Ohio (4)
- Utah (4)
- Washington (4)
- Texas (3)
- Oregon (2)
- Virginia (2)
- Nebraska (2)
- Missouri (1)
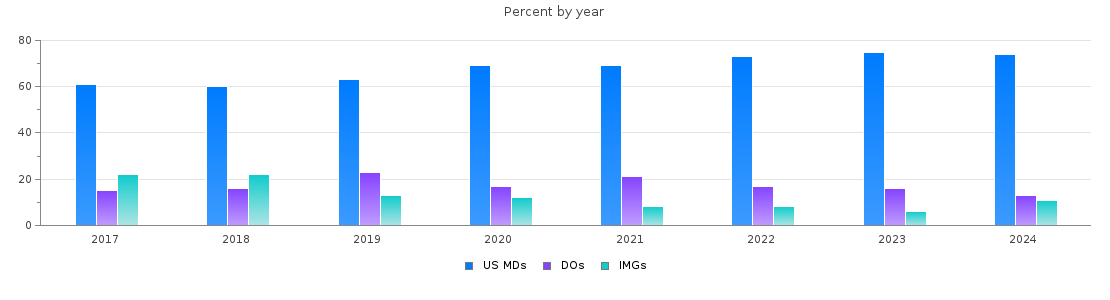
Percent MD,DO,IMG Anesthesiology PGY-2 residents (main match)
Anesthesiology PGY-2 main residency Match statistics
| Year | Positions | Filled(%) | MD | DO | IMGs |
| 2026 | 306 | 100.0 | 238 (77 %) | 48 (15 %) | 20 (6 %) |
| 2025 | 311 | 99.7 | 234 (75 %) | 49 (15 %) | 27 (8 %) |
| 2024 | 305 | 100.0 | 228 (74 %) | 41 (13 %) | 36 (11 %) |
| 2023 | 301 | 100.0 | 228 (75 %) | 51 (16 %) | 21 (6 %) |
| 2022 | 346 | 100.0 | 255 (73 %) | 60 (17 %) | 31 (8 %) |
| 2021 | 339 | 100.0 | 236 (69 %) | 74 (21 %) | 29 (8 %) |
| 2020 | 398 | 99.5 | 276 (69 %) | 70 (17 %) | 50 (12 %) |
| 2019 | 425 | 98.1 | 264 (62 %) | 96 (22 %) | 57 (13 %) |
| 2018 | 447 | 98.9 | 267 (59 %) | 75 (16 %) | 99 (22 %) |
| 2017 | 441 | 93.9 | 256 (58 %) | 63 (14 %) | 95 (21 %) |