
Neurological surgery Residency
PGY-1 Neurological surgery residency positions by state
- New York (28)
- California (27)
- Pennsylvania (19)
- Texas (17)
- Illinois (15)
- Ohio (14)
- Florida (12)
- North Carolina (10)
- Massachusetts (10)
- Michigan (10)
- Virginia (8)
- Arizona (8)
- Louisiana (7)
- Maryland (7)
- Missouri (7)
- Tennessee (7)
- Minnesota (6)
- Wisconsin (6)
- Georgia (5)
- Washington (4)
- Indiana (4)
- Kentucky (4)
- New Jersey (4)
- Colorado (3)
- Connecticut (3)
- District of Columbia (3)
- Oregon (3)
- Alabama (3)
- Iowa (3)
- Utah (2)
- Oklahoma (2)
- West Virginia (2)
- Mississippi (2)
- Nebraska (2)
- Rhode Island (2)
- Kansas (2)
- Arkansas (2)
- South Carolina (2)
- New Mexico (1)
- Maine (1)
- Vermont (1)
- Puerto Rico (1)
- New Hampshire (1)
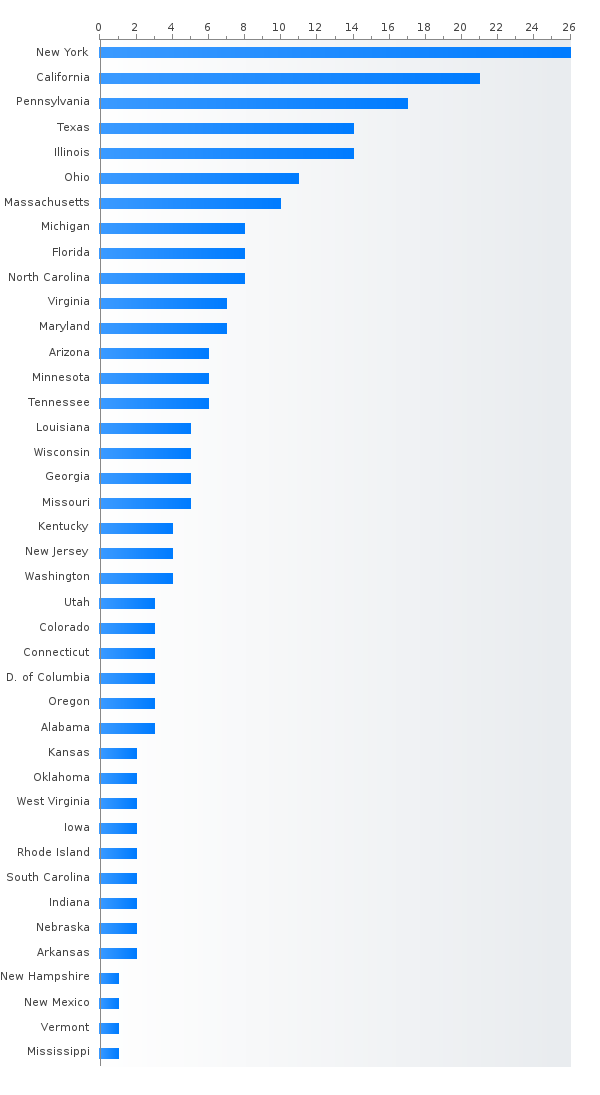
Top size Neurological surgery residency programs by state
ID / Ranking Program State
Search residency programs by criteria to find all the programs you really need!
Percent MD,DO,IMG Neurological surgery PGY-1 residents (main match)
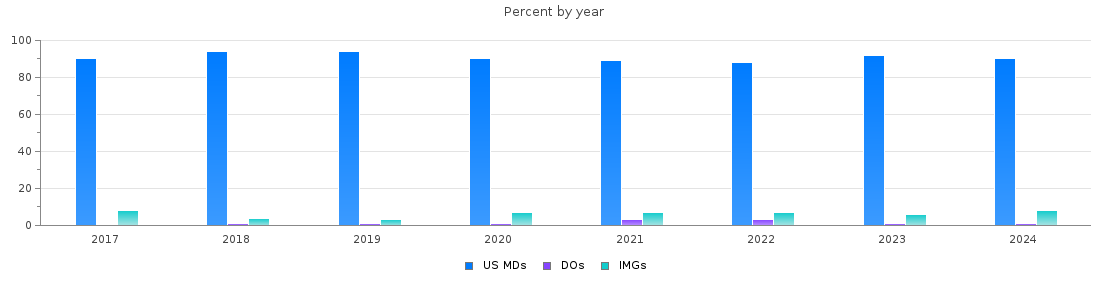
Neurological surgery PGY-1 main residency Match statistics
| Year | Positions | Filled(%) | MD | DO | IMGs |
| 2026 | 280 | 100.0 | 254 (90 %) | 9 (3 %) | 17 (6 %) |
| 2025 | 268 | 98.9 | 242 (90 %) | 5 (1 %) | 18 (6 %) |
| 2024 | 241 | 100.0 | 217 (90 %) | 4 (1 %) | 20 (8 %) |
| 2023 | 243 | 98.8 | 221 (90 %) | 4 (1 %) | 15 (6 %) |
| 2022 | 240 | 100.0 | 213 (88 %) | 9 (3 %) | 18 (7 %) |
| 2021 | 234 | 100.0 | 209 (89 %) | 8 (3 %) | 17 (7 %) |
| 2020 | 232 | 100.0 | 211 (90 %) | 3 (1 %) | 18 (7 %) |
| 2019 | 228 | 99.6 | 215 (94 %) | 4 (1 %) | 8 (3 %) |
| 2018 | 225 | 100.0 | 212 (94 %) | 3 (1 %) | 10 (4 %) |
| 2017 | 218 | 100.0 | 198 (90 %) | 2 (0.9 %) | 18 (8 %) |