
Radiation oncology Residency
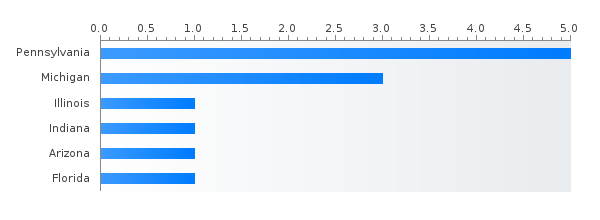
PGY-1 Radiation oncology residency positions by state
Top size Radiation oncology residency programs by state
ID / Ranking Program State
Search residency programs by criteria to find all the programs you really need!
Percent MD,DO,IMG Radiation oncology PGY-1 residents (main match)
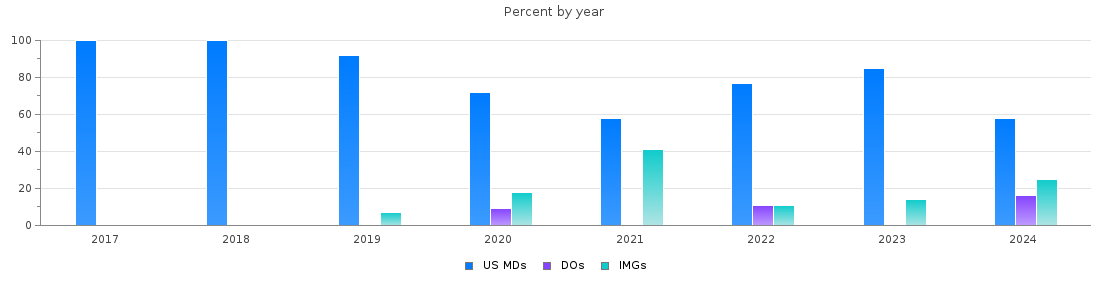
Radiation oncology PGY-1 main residency Match statistics
| Year | Positions | Filled(%) | MD | DO | IMGs |
| 2026 | 12 | 100.0 | 8 (66 %) | 2 (16 %) | 2 (16 %) |
| 2025 | 12 | 100.0 | 9 (75 %) | 1 (8 %) | 2 (16 %) |
| 2024 | 12 | 100.0 | 7 (58 %) | 2 (16 %) | 3 (25 %) |
| 2023 | 10 | 70.0 | 6 (60 %) | 0 (0 %) | 1 (10 %) |
| 2022 | 10 | 90.0 | 7 (70 %) | 1 (10 %) | 1 (10 %) |
| 2021 | 15 | 80.0 | 7 (46 %) | 0 (0 %) | 5 (33 %) |
| 2020 | 14 | 78.6 | 8 (57 %) | 1 (7 %) | 2 (14 %) |
| 2019 | 15 | 93.3 | 13 (86 %) | 0 (0 %) | 1 (6 %) |
| 2018 | 16 | 93.8 | 15 (93 %) | 0 (0 %) | 0 (0 %) |
| 2017 | 16 | 100.0 | 16 (100 %) | 0 (0 %) | 0 (0 %) |
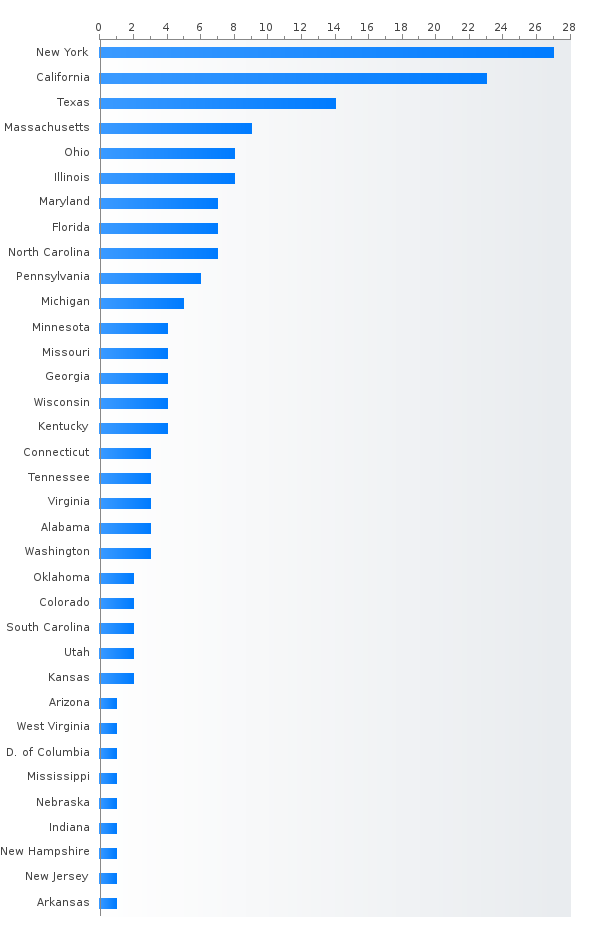
PGY-2 Radiation oncology residency positions by state
- New York (24)
- California (24)
- Texas (15)
- Massachusetts (9)
- Ohio (8)
- Maryland (7)
- Florida (7)
- Illinois (7)
- North Carolina (6)
- Michigan (6)
- Pennsylvania (6)
- Wisconsin (5)
- Connecticut (4)
- Missouri (4)
- Kentucky (3)
- Minnesota (3)
- Georgia (3)
- Utah (2)
- Iowa (2)
- New Jersey (2)
- Alabama (2)
- Kansas (2)
- Washington (2)
- Colorado (2)
- Oklahoma (2)
- Oregon (2)
- Mississippi (2)
- Tennessee (2)
- Indiana (1)
- New Hampshire (1)
- Virginia (1)
- Arizona (1)
- West Virginia (1)
- District of Columbia (1)
- South Carolina (1)
- Nebraska (1)
Percent MD,DO,IMG Radiation oncology PGY-2 residents (main match)
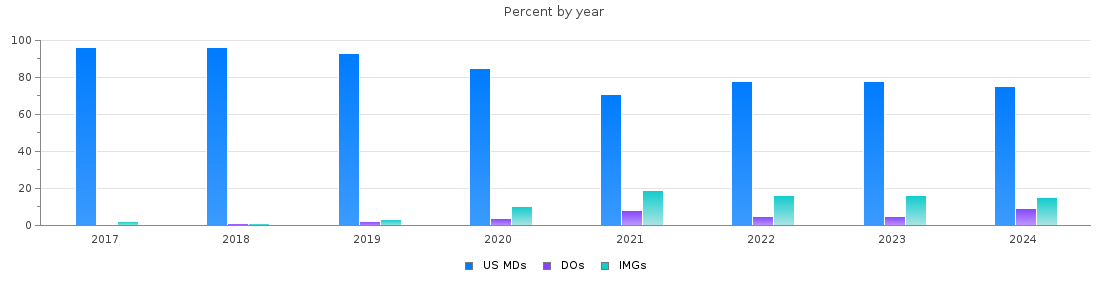
Radiation oncology PGY-2 main residency Match statistics
| Year | Positions | Filled(%) | MD | DO | IMGs |
| 2026 | 171 | 97.7 | 131 (76 %) | 18 (10 %) | 18 (10 %) |
| 2025 | 179 | 97.2 | 130 (72 %) | 15 (8 %) | 29 (16 %) |
| 2024 | 175 | 93.1 | 123 (70 %) | 15 (8 %) | 25 (14 %) |
| 2023 | 181 | 81.2 | 115 (63 %) | 8 (4 %) | 24 (13 %) |
| 2022 | 166 | 80.7 | 105 (63 %) | 7 (4 %) | 22 (13 %) |
| 2021 | 173 | 79.8 | 99 (57 %) | 12 (6 %) | 27 (15 %) |
| 2020 | 175 | 81.7 | 122 (69 %) | 6 (3 %) | 15 (8 %) |
| 2019 | 190 | 85.3 | 152 (80 %) | 4 (2 %) | 6 (3 %) |
| 2018 | 177 | 97.2 | 166 (93 %) | 3 (1 %) | 3 (1 %) |
| 2017 | 177 | 97.7 | 167 (94 %) | 1 (0.6 %) | 5 (2 %) |