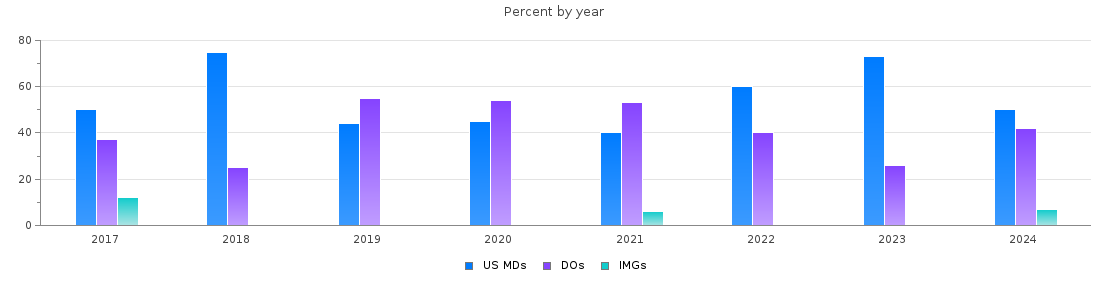
Physical medicine and rehabilitation PGY-1 main residency Match statistics in Ohio
| Year |
Positions |
Filled(%) |
MD |
DO |
IMGs |
| 2026 |
15 |
100.0 |
11 (73%) |
4 (26%) |
0 (0%) |
| 2025 |
15 |
100.0 |
10 (66%) |
5 (33%) |
0 (0%) |
| 2024 |
14 |
100.0 |
7 (50%) |
6 (42%) |
1 (7%) |
| 2023 |
15 |
100.0 |
11 (73%) |
4 (26%) |
0 (0%) |
| 2022 |
15 |
100.0 |
9 (60%) |
6 (40%) |
0 (0%) |
| 2021 |
15 |
100.0 |
6 (40%) |
8 (53%) |
1 (6%) |
| 2020 |
11 |
100.0 |
5 (45%) |
6 (54%) |
0 (0%) |
| 2019 |
9 |
100.0 |
4 (44%) |
5 (55%) |
0 (0%) |
| 2018 |
8 |
100.0 |
6 (75%) |
2 (25%) |
0 (0%) |
| 2017 |
8 |
100.0 |
4 (50%) |
3 (37%) |
1 (12%) |
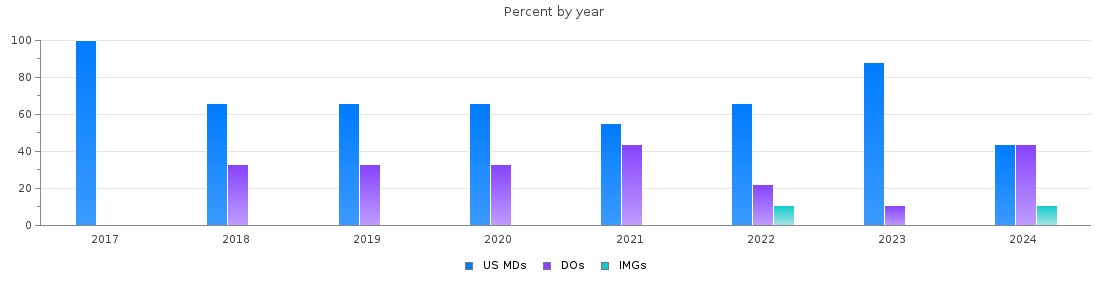
Physical medicine and rehabilitation PGY-2 main residency Match statistics in Ohio
| Year |
Positions |
Filled(%) |
MD |
DO |
IMGs |
| 2026 |
9 |
100.0 |
8 (88%) |
0 (0%) |
1 (11%) |
| 2025 |
9 |
100.0 |
5 (55%) |
3 (33%) |
1 (11%) |
| 2024 |
9 |
100.0 |
4 (44%) |
4 (44%) |
1 (11%) |
| 2023 |
9 |
100.0 |
8 (88%) |
1 (11%) |
0 (0%) |
| 2022 |
9 |
100.0 |
6 (66%) |
2 (22%) |
1 (11%) |
| 2021 |
9 |
100.0 |
5 (55%) |
4 (44%) |
0 (0%) |
| 2020 |
12 |
100.0 |
8 (66%) |
4 (33%) |
0 (0%) |
| 2019 |
12 |
100.0 |
8 (66%) |
4 (33%) |
0 (0%) |
| 2018 |
12 |
100.0 |
8 (66%) |
4 (33%) |
0 (0%) |
| 2017 |
12 |
100.0 |
12 (100%) |
0 (0%) |
0 (0%) |