
IMG friendly Child neurology Residency Programs
Top 10 Child neurology IMG friendly residencies
ID / Ranking Program State
Search residency programs by criteria to find all the programs you really need!
Top Child neurology IMG friendly states based on PGY-1 main residency Match statistics
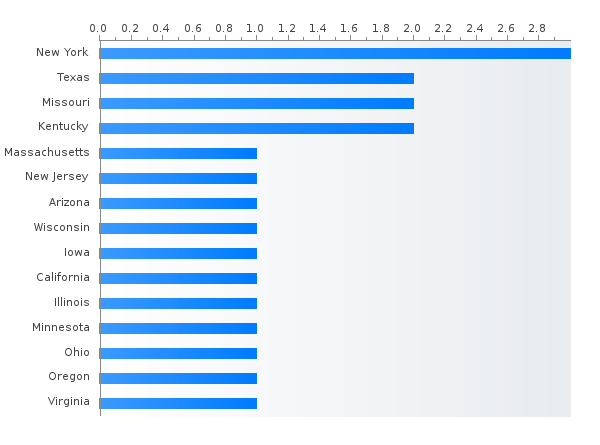
Top Child neurology IMG friendly by number
- New York (6 IMGs)
- Texas (6 IMGs)
- Arizona (5 IMGs)
- Kentucky (3 IMGs)
- Missouri (3 IMGs)
- New Jersey (2 IMGs)
- Wisconsin (2 IMGs)
- Iowa (2 IMGs)
- Oklahoma (2 IMGs)
- Florida (1 IMGs)
- Virginia (1 IMGs)
- Pennsylvania (1 IMGs)
- North Carolina (1 IMGs)
- Tennessee (1 IMGs)
- Ohio (1 IMGs)
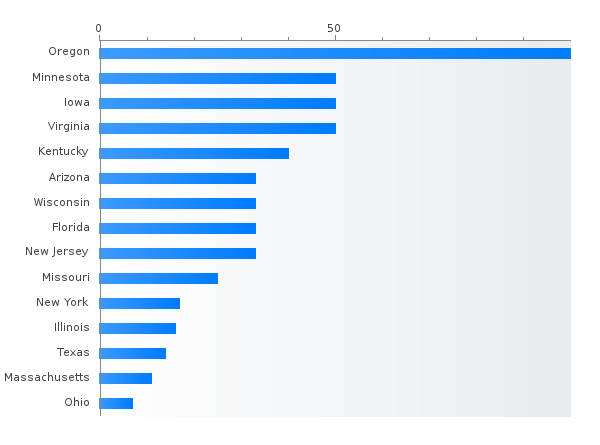
Top Child neurology IMG friendly by percent
- Iowa (100% IMGs)
- Oklahoma (100% IMGs)
- Arizona (83% IMGs)
- New Jersey (66% IMGs)
- Wisconsin (66% IMGs)
- Connecticut (50% IMGs)
- Kentucky (42% IMGs)
- Virginia (33% IMGs)
- Florida (33% IMGs)
- Missouri (30% IMGs)
- Texas (30% IMGs)
- New York (30% IMGs)
- North Carolina (16% IMGs)
- Tennessee (16% IMGs)
- Ohio (7% IMGs)
Child neurology PGY-1 main residency Match percent IMGs by year
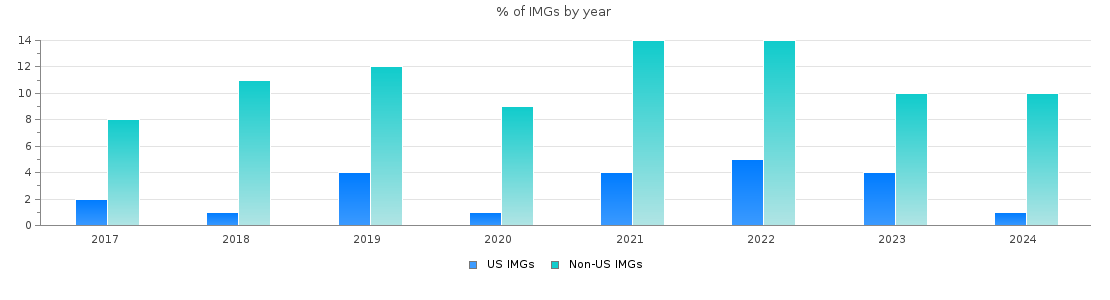
Child neurology total PGY-1 positions offered and percent of IMGs filled by year
| Year | Positions | IMGs | IMGs % | US IMG % | Non-US IMG % |
| 2026 | 211 | 38 | 18 | 4 | 14 |
| 2025 | 195 | 33 | 17 | 2 | 15 |
| 2024 | 184 | 21 | 11 | 1 | 10 |
| 2023 | 177 | 26 | 14 | 4 | 10 |
| 2022 | 166 | 30 | 19 | 5 | 14 |
| 2021 | 159 | 28 | 18 | 4 | 14 |
| 2020 | 159 | 17 | 10 | 1 | 9 |
| 2019 | 142 | 22 | 16 | 4 | 12 |
| 2018 | 134 | 17 | 12 | 1 | 11 |
| 2017 | 128 | 13 | 10 | 2 | 8 |
Child neurology total PGY-2 positions offered and percent of IMGs filled by year
| Year | Positions | IMGs | IMGs % | US IMG % | Non-US IMG % |
| 2026 | 9 | 4 | 49 | 37 | 12 |
| 2025 | 8 | 3 | 49 | 16 | 33 |
| 2024 | 6 | 2 | 32 | 16 | 16 |
| 2023 | 6 | 2 | 33 | 0 | 33 |
| 2022 | 7 | 0 | 0 | 0 | 0 |
| 2021 | 8 | 4 | 66 | 16 | 50 |
| 2020 | 9 | 3 | 49 | 16 | 33 |
| 2019 | 10 | 4 | 44 | 0 | 44 |
| 2018 | 8 | 3 | 42 | 14 | 28 |
| 2017 | 11 | 2 | 22 | 0 | 22 |