
Transitional year Residency Programs in Texas
Percent MD,DO,IMG PGY-1 residents matched during the main Match
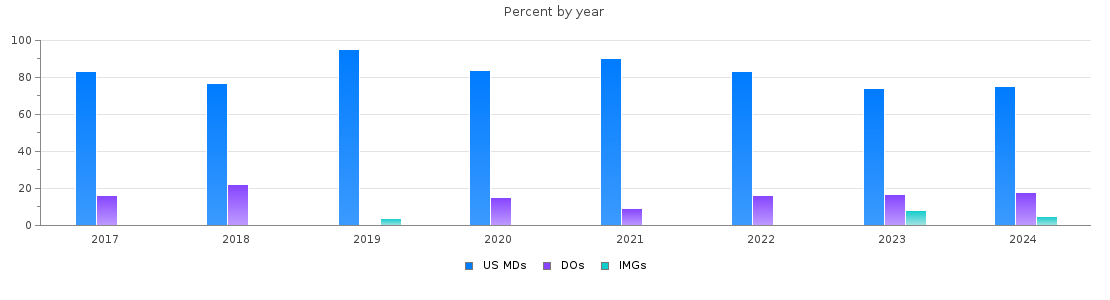
Transitional year PGY-1 main residency Match statistics in Texas
| Year | Positions | Filled(%) | MD | DO | IMGs |
| 2026 | 87 | 88.5 | 57 (65%) | 11 (12%) | 9 (10%) |
| 2025 | 73 | 97.3 | 56 (76%) | 12 (16%) | 3 (4%) |
| 2024 | 69 | 100.0 | 52 (75%) | 13 (18%) | 4 (5%) |
| 2023 | 101 | 80.2 | 60 (59%) | 14 (13%) | 7 (6%) |
| 2022 | 76 | 89.5 | 57 (75%) | 11 (14%) | 0 (0%) |
| 2021 | 61 | 86.9 | 48 (78%) | 5 (8%) | 0 (0%) |
| 2020 | 61 | 54.1 | 28 (45%) | 5 (8%) | 0 (0%) |
| 2019 | 22 | 100.0 | 21 (95%) | 0 (0%) | 1 (4%) |
| 2018 | 18 | 100.0 | 14 (77%) | 4 (22%) | 0 (0%) |
| 2017 | 18 | 100.0 | 15 (83%) | 3 (16%) | 0 (0%) |