Transitional year Residency Programs in South Carolina
Percent MD,DO,IMG PGY-1 residents matched during the main Match
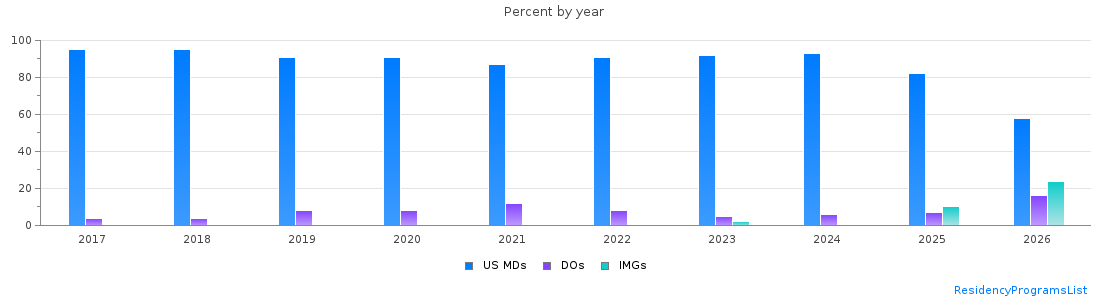
Transitional year PGY-1 main residency Match statistics in South Carolina
| Year | Positions | Filled(%) | MD | DO | IMGs |
| 2026 | 56 | 94.6 | 31 (55%) | 9 (16%) | 13 (23%) |
| 2025 | 56 | 71.4 | 33 (58%) | 3 (5%) | 4 (7%) |
| 2024 | 37 | 86.5 | 30 (81%) | 2 (5%) | 0 (0%) |
| 2023 | 52 | 73.1 | 35 (67%) | 2 (3%) | 1 (1%) |
| 2022 | 24 | 100.0 | 22 (91%) | 2 (8%) | 0 (0%) |
| 2021 | 24 | 100.0 | 21 (87%) | 3 (12%) | 0 (0%) |
| 2020 | 24 | 100.0 | 22 (91%) | 2 (8%) | 0 (0%) |
| 2019 | 24 | 100.0 | 22 (91%) | 2 (8%) | 0 (0%) |
| 2018 | 24 | 100.0 | 23 (95%) | 1 (4%) | 0 (0%) |
| 2017 | 24 | 95.8 | 22 (91%) | 1 (4%) | 0 (0%) |