
Transitional year Residency Programs in California
Percent MD,DO,IMG PGY-1 residents matched during the main Match
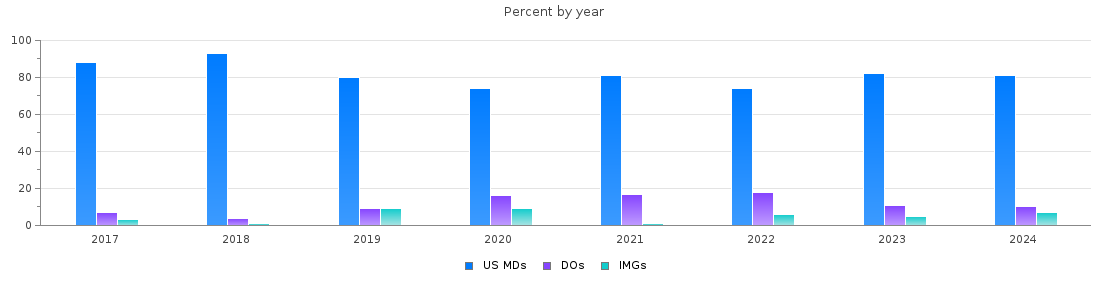
Transitional year PGY-1 main residency Match statistics in California
| Year | Positions | Filled(%) | MD | DO | IMGs |
| 2026 | 202 | 93.6 | 153 (75%) | 24 (11%) | 12 (5%) |
| 2025 | 188 | 89.4 | 129 (68%) | 28 (14%) | 11 (5%) |
| 2024 | 160 | 96.9 | 126 (78%) | 17 (10%) | 12 (7%) |
| 2023 | 119 | 100.0 | 98 (82%) | 14 (11%) | 7 (5%) |
| 2022 | 126 | 96.8 | 91 (72%) | 23 (18%) | 8 (6%) |
| 2021 | 114 | 85.1 | 79 (69%) | 17 (14%) | 1 (0.9%) |
| 2020 | 95 | 91.6 | 65 (68%) | 14 (14%) | 8 (8%) |
| 2019 | 82 | 98.8 | 65 (79%) | 8 (9%) | 8 (9%) |
| 2018 | 67 | 97.0 | 61 (91%) | 3 (4%) | 1 (1%) |
| 2017 | 57 | 94.7 | 48 (84%) | 4 (7%) | 2 (3%) |