Physical medicine and rehabilitation Residency Programs in District of Columbia
ID Program City
Search residency programs by criteria to find all the programs you really need!
Percent MD,DO,IMG PGY-1 residents matched during the main Match
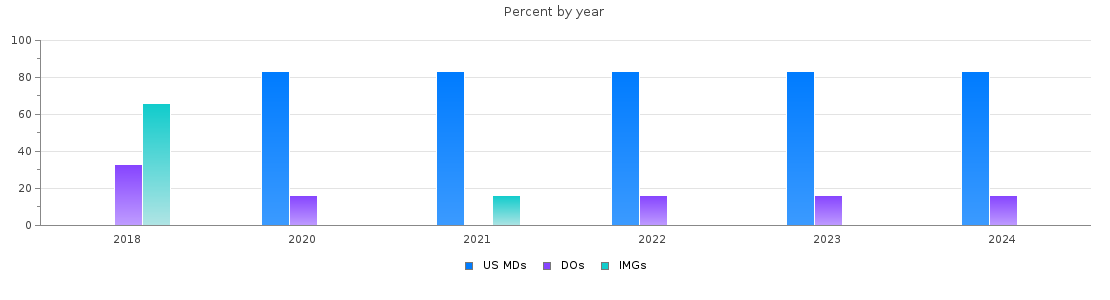
Physical medicine and rehabilitation PGY-1 main residency Match statistics in District of Columbia
| Year | Positions | Filled(%) | MD | DO | IMGs |
| 2026 | 6 | 100.0 | 3 (50%) | 2 (33%) | 1 (16%) |
| 2025 | 6 | 100.0 | 6 (100%) | 0 (0%) | 0 (0%) |
| 2024 | 6 | 100.0 | 5 (83%) | 1 (16%) | 0 (0%) |
| 2023 | 6 | 100.0 | 5 (83%) | 1 (16%) | 0 (0%) |
| 2022 | 6 | 100.0 | 5 (83%) | 1 (16%) | 0 (0%) |
| 2021 | 6 | 100.0 | 5 (83%) | 0 (0%) | 1 (16%) |
| 2020 | 6 | 100.0 | 5 (83%) | 1 (16%) | 0 (0%) |
| 2018 | 6 | 100.0 | 0 (0%) | 2 (33%) | 4 (66%) |
Percent MD,DO,IMG PGY-2 residents matched during the main Match
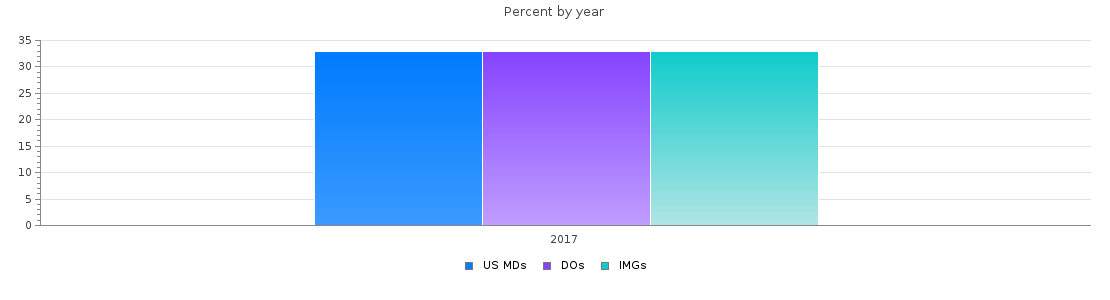
Physical medicine and rehabilitation PGY-2 main residency Match statistics in District of Columbia
| Year | Positions | Filled(%) | MD | DO | IMGs |
| 2017 | 6 | 100.0 | 2 (33%) | 2 (33%) | 2 (33%) |