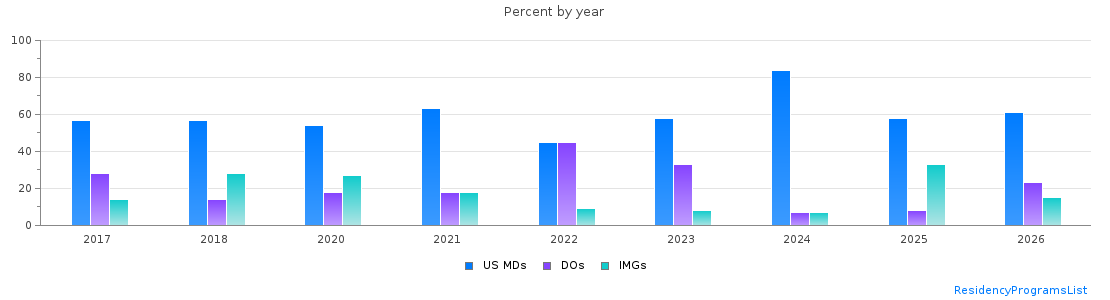
Neurology PGY-1 main residency Match statistics in District of Columbia
| Year |
Positions |
Filled(%) |
MD |
DO |
IMGs |
| 2026 |
14 |
92.9 |
8 (57%) |
3 (21%) |
2 (14%) |
| 2025 |
12 |
100.0 |
7 (58%) |
1 (8%) |
4 (33%) |
| 2024 |
13 |
100.0 |
11 (84%) |
1 (7%) |
1 (7%) |
| 2023 |
12 |
100.0 |
7 (58%) |
4 (33%) |
1 (8%) |
| 2022 |
11 |
100.0 |
5 (45%) |
5 (45%) |
1 (9%) |
| 2021 |
11 |
100.0 |
7 (63%) |
2 (18%) |
2 (18%) |
| 2020 |
11 |
100.0 |
6 (54%) |
2 (18%) |
3 (27%) |
| 2018 |
7 |
100.0 |
4 (57%) |
1 (14%) |
2 (28%) |
| 2017 |
7 |
100.0 |
4 (57%) |
2 (28%) |
1 (14%) |
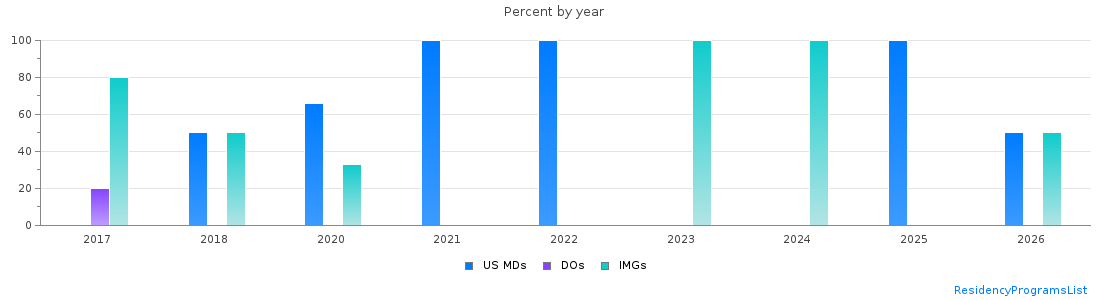
Neurology PGY-2 main residency Match statistics in District of Columbia
| Year |
Positions |
Filled(%) |
MD |
DO |
IMGs |
| 2026 |
2 |
100.0 |
1 (50%) |
0 (0%) |
1 (50%) |
| 2025 |
1 |
100.0 |
1 (100%) |
0 (0%) |
0 (0%) |
| 2024 |
2 |
100.0 |
0 (0%) |
0 (0%) |
2 (100%) |
| 2023 |
2 |
100.0 |
0 (0%) |
0 (0%) |
2 (100%) |
| 2022 |
2 |
100.0 |
2 (100%) |
0 (0%) |
0 (0%) |
| 2021 |
1 |
100.0 |
1 (100%) |
0 (0%) |
0 (0%) |
| 2020 |
3 |
100.0 |
2 (66%) |
0 (0%) |
1 (33%) |
| 2018 |
6 |
100.0 |
3 (50%) |
0 (0%) |
3 (50%) |
| 2017 |
6 |
83.3 |
0 (0%) |
1 (16%) |
4 (66%) |